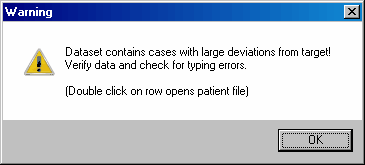
When starting the nomogram verification tool you may see a warning message 'large deviations from target'. This warning appears whenever the selected data set contains eyes which have more than ±2 D of difference between laser settings and achieved changed of refraction because differences of ±2 D or more diopters seem unlikely and may be due to typing errors or other reasons. You should review, verify and if necessary exclude these cases from analysis before continuing.

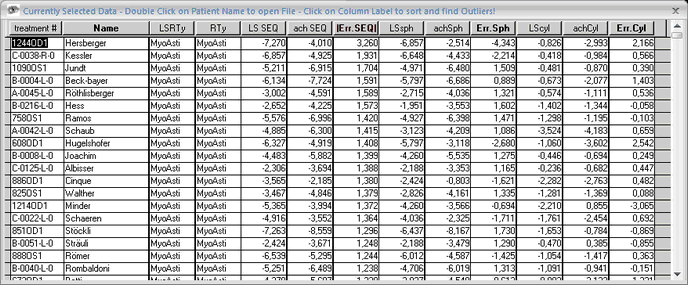
In case the warning message came up a table with your current data set appears. This table is by default sorted by the absolute value of the difference between Laser Setting (SEQ) and Achieved (change in) SEQ. (Column heading = |Err.SEQ|)
A double click on the patient name which is on top of the list brings you to the data entry form of this treatment which has the largest deviation from target. Correct wrong data or exclude this treatment by using the 'exclude from analysis' check mark.
Note: Sorting is possible by every column which may help you to find outliers in your data set. To sort click on column headings, a second click on the same column heading changes sort order.

The table does not appear automatically if your data set has no deviations over ±2 D but you may bring up this table any time by clicking on the 'show data' icon.

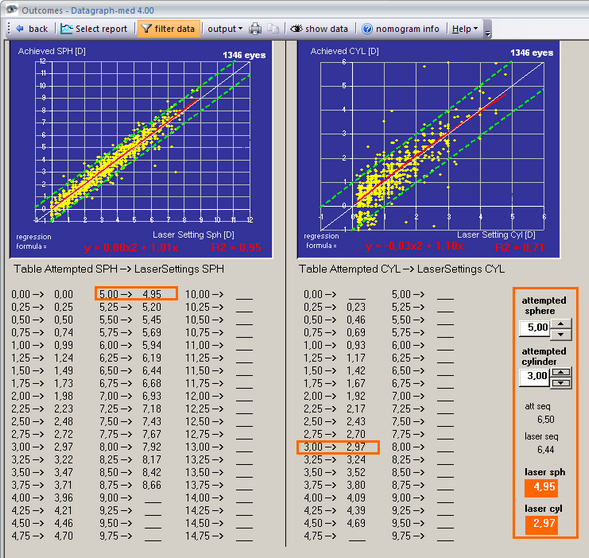
The nomogram verification tool is based on two 'laser setting vs. Achieved change in correction' scatter plots. They show how much change of sph and cyl was achieved for a certain laser input value.
Hint: Users of former versions of Datagraph-med will notice that the left scatter plot now displays laser setting sph vs. achieved change in sph and not LS SEQ vs. achieved change in SEQ.
The calculations are based on the shape and position of the red trend lines. They represent a 2nd order polynomial fit with forced intercept at zero. Do not use data sets with an obviously high scatter as the polynomial trend line (regression) will not be a valid description for this data. Any unusual shaped trendlines or obvious discrepancy between the yellow dots and the location of the trendline must be excluded from nomogram considerations.

To see the suggested laser setting (which is based on the currently selected data) use the up and down buttons to the right of the 'attempted sph' and 'attempted cyl' fields in the orange box. In the example above the nomogram would suggest laser settings of -4.95 sph and -2.97 cyl when attempting a -5 / -3 D correction.
Note: Here you have to enter refractions as absolute values, ignoring the sign. Use Minus-cylinder notation for myopic Asti and Plus-cylinder notation for Hyp Asti.
The R-Squared value given on the lower part of this graphs must be higher than 0.9 for sphere and cylinder. If your R² values are smaller the first step before making nomograms has to be to reduce the scatter in your outcomes. This may be achieved by narrowing the filter conditions, searching and excluding outliers or may even need chaning your surgical technique. You can't expect good nomograms based on a highly scattered data set.