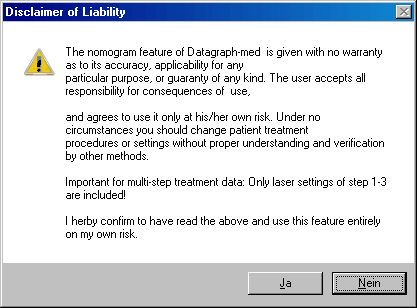
Important! Due to the complexity of data entry and analysis steps and programming we can not guarantee for its proper function. So you have to be aware of this and accept to use Datagraph-med and its Nomogram features on your own risk. No claims shall be made against Ingenieurbüro Pieger GmbH, its employees, programmers or distributors whenever it comes to patient claims because of bad results. Contact your laser manufacturer before making any changes to your nomograms!
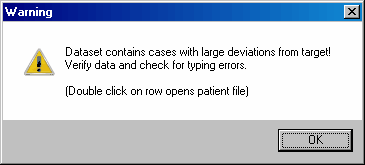
You may see a warning message 'large deviations from target' during startup of the advanced nomogram tool. This appears whenever the selected data set contains eyes which have more than 2 D of difference between laser settings and achieved changed in refraction because differences of 2 or more diopters seem unlikely and may be due to typing errors or other reasons. You should review these cases and exclude from analysis if the reason is unclear.
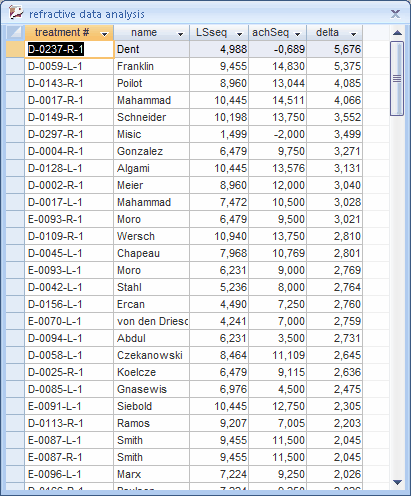
In case the warning message was shown a table with your current data set appears, sorted by the absolute value of the difference Laser Setting (SEQ) - Achieved (change in) SEQ. Double click on one of the top rows brings you to the cases which seem to have an unusual large deviation from their target.
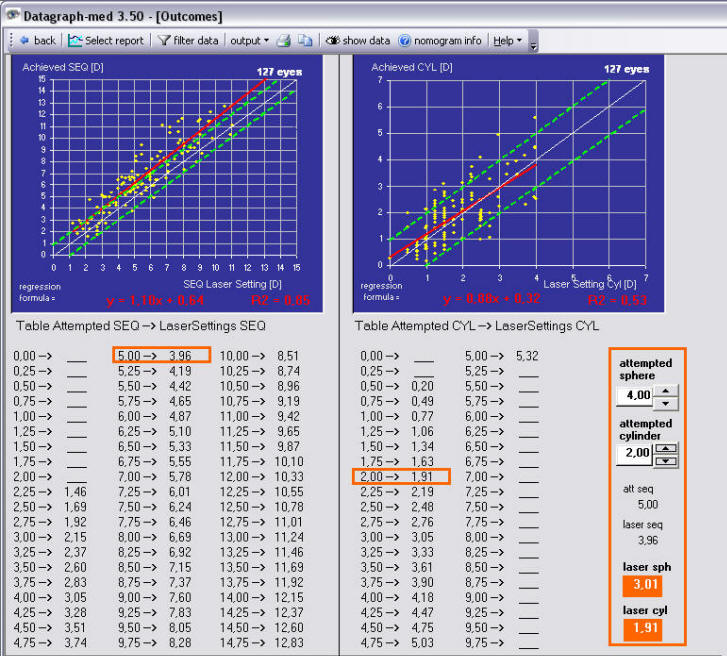
Based on two 'laser setting vs. Achieved change in correction' scatter plots it is possible to determine how much laser entry values must be changed to get the desired outcomes. As sphere and cylinder treatments are often linked to each other the analysis must be include both at a time (unless your analysis is simply for spherical treatments). The calculator in the orange box shows the suggested laser settings for a certain combination of attempted sphere and cyl. Use the up and down buttons to the right of the 'att sph' and 'att cyl' box to enter a certain sph/cyl combination as absolute values, ignoring the sign. (Interpretation is 'Minus-Minus' for myopic Asti and 'Plus-Plus' for Hyp Asti). It is essential however to choose useful filter settings to the right of this graph.
The calculations are based on the position of the red trend lines which can either be based on polynomial regression analysis (default) or linear regression analysis. This can be changed in the 'Tools'-'Graph Options' menu. It can be dangerous to use data sets with high scatter as neither the polynomial nor the linear trend line (regression) will be valid for this patient cohort. For that reason the R-Squared value given on the lower part of this graphs must be reasonably close to 1. Values of 0.9 for sphere and 0.8 or better for the cylinder seem realistic. If your R² values are smaller the first step before making nomograms has to be to reduce the scatter in your outcomes. This may be achieved by narrowing the filter conditions for example, but also by standardizing your surgical technique.