Attempted vs. Achieved Spherical Equivalent over Time Graph
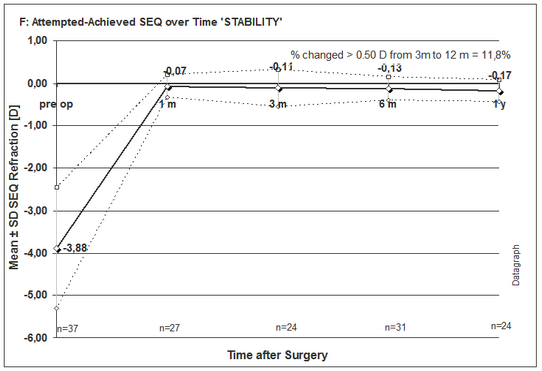
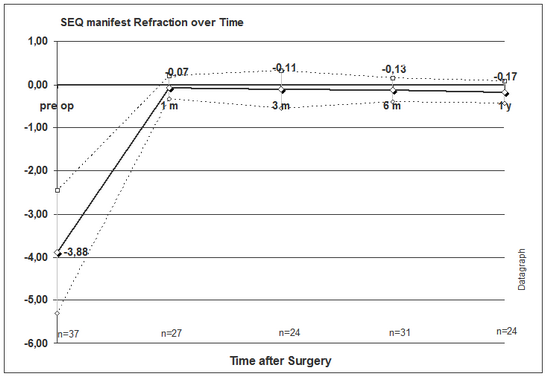
This graph shows the attempted vs. achieved change in refraction as average spherical equivalent (SEQ = SPH+CYL/2). Base is the subjective ('manifest') refraction.
If the target refraction was not plano (like in cases of Monvision for example) they will appear as 'plano' if the target refraction was achieved.
The dashed lines indicate ±1 standard deviation of the distribution of the individual values. At the bottom of the graphs the number of eyes per follow up point is given.
According to journal requirements the percentage of eyes which changed their refraction by more than 0.5 D between month 3 and month 12 is given.
Note: By default this graph displays only follow data falling into the 0-1-3-6-12... month grid. De-selecting the 'show only 1.3.6...' option will display all available follow up data.
A second Refraction over time graph can be found under 'Refractive outcome'. This graph plots simply average pre and postOP manifest refraction SEQ. This graph shows the actual refraction. It should not be used for patient groups which had a target refraction other than plano.