Datagraph-med uses vector analysis to calculate the surgically induced refractive change (SIRC) taking into account whether or not the clinder axis has changed. This is done for each follow up exam individually and can be seen on the astigmatism tab in the data entry form.
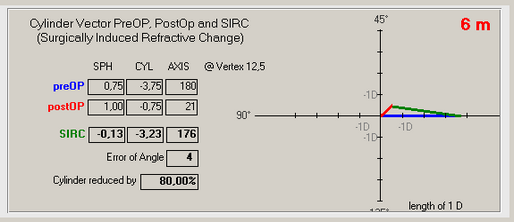
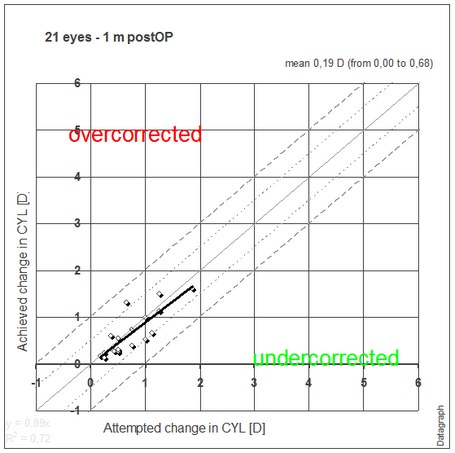
When plotting astigmatism graphs the amount of achieved change in cylinder is using this vectorial change as magnitude. Cases above the 45° line represent an overcorrection in cylinder and cases below an undercorrection. Cases below the X-axis indicate that cylinder has been induced compared to their preOP value.
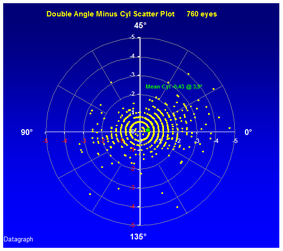
The above graph is a simplified view of the vectorial changes however and a second type of scatter graph which plots magnitude and axis as polar plot is needed. The cylinder axis is doubled on this graph showing axis values of 0 and 180° in the same quadrant.
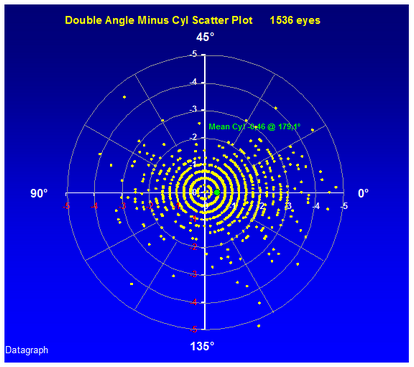
Double angle cylinder scatter plot. OS+OD preOP
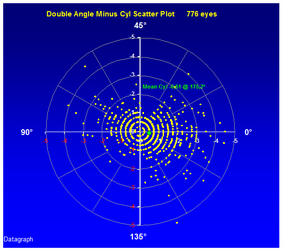
The mean cylinder and axis is given as green dot. This graph may be helpful to check if your surgery induces cylinder at a certain axis. Below the same patient group 3 month post operatively showing a remarkable reduction in cylinder magnitude and no significant change in average axis.
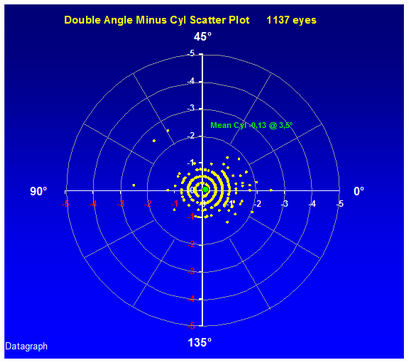
Double angle cylinder scatter plot OS+OD 3 month postOP
You may have to check this for left and right eyes separately due to mirror symmetry of axis values between OS and OD.
OD - PreOP OS - PreOP
An alternative graph is the Normalized double angle scatter plot. All preOP axis values are set to zero and the postOP graph shows the change in axis together with its cylinder magnitude.
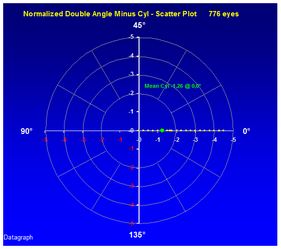
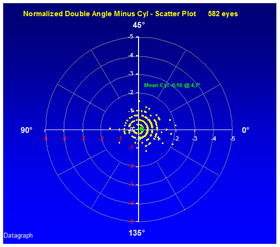
OD+OS - PreOP OD+OS - PreOP